THE AUDITORY MODELING TOOLBOX
This documentation page applies to an outdated AMT version (1.1.0). Click here for the most recent page.
EXP_OSSES2021 - -
Usage
data = exp_osses2021(flags)
Description
exp_osses2021 reproduces Figs. 4, 11 and 14 from Osses and Kohlrausch (2021), where a modified version of the dau1997 model is used. The figures are similar to Figs. 4.14, C.9B, and C.11B from Osses (2018).
The following flags can be specified:
| 'redo' | Recomputes data for specified figure |
| 'plot' | Plot the output of the experiment. This is the default. |
| 'no_plot' | Don't plot, only return data. |
| 'fig4_osses2020' | Reproduce Fig. 4 of Osses et al. (2020). |
| 'fig14_osses2020' | Reproduce Fig. 14 of Osses et al. (2020). |
| 'fig4' | Reproduce Fig. 4 of Osses and Kohlrausch (2021). This is the same figure as Fig. 4 of Osses and Kohlrausch (2020, preprint) |
| 'fig11' | Reproduce Fig. 11 of Osses and Kohlrausch (2021). This is the same figure as Fig. 14 of Osses and Kohlrausch (2020, preprint) |
| 'fig14' | Reproduce Fig. 14 of Osses and Kohlrausch (2021). |
Fig. 4 - Two internal representations of a piano sound ('P1') using the PEMO model with two configurations of the adaptation loops are shown: Overshoot limitation with a factor of 5, as suggested in Osses and Kohlrausch (2021), and with a factor of 10 (see Dau et al., 1997). To display Fig. 4 of Osses and Kohlrausch (2021) use
out = exp_osses2021('fig4'); % same as: out = exp_dau1997('fig4_osses2020');

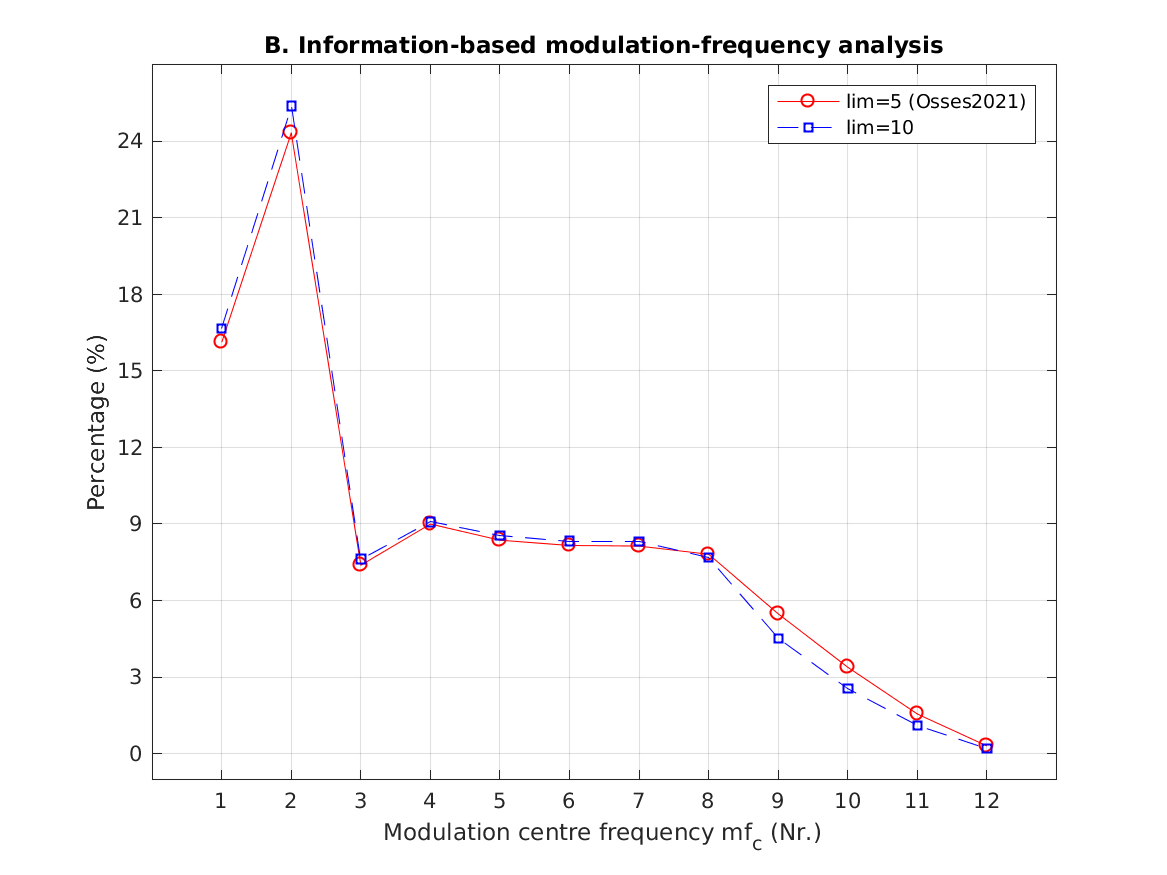
Fig. 11 - The effect of the overshoot limitation with factors of 5 and 10 are shown for a 4-kHz pure tone of 70 dB SPL that includes 2.5-ms up/down ramps. For these plots the outer and middle ear stages are skipped. One gammatone filter at 4 kHz is used, followed by the IHC stage (ihc_breebaart2001), and the adaptation loops (adt_osses2021 for lim=5, adt_dau1997 for lim=10).
To display Fig. 11 of Osses and (2020) use
out = exp_osses2021('fig11'); % same as: out = exp_dau1997('fig14_osses2020');
This code produces the following output:
Lim  5: Onset = 614.3 MU, steady = 66.2 MU
Lim 10: Onset = 1432.3 MU, steady = 63.7 MU
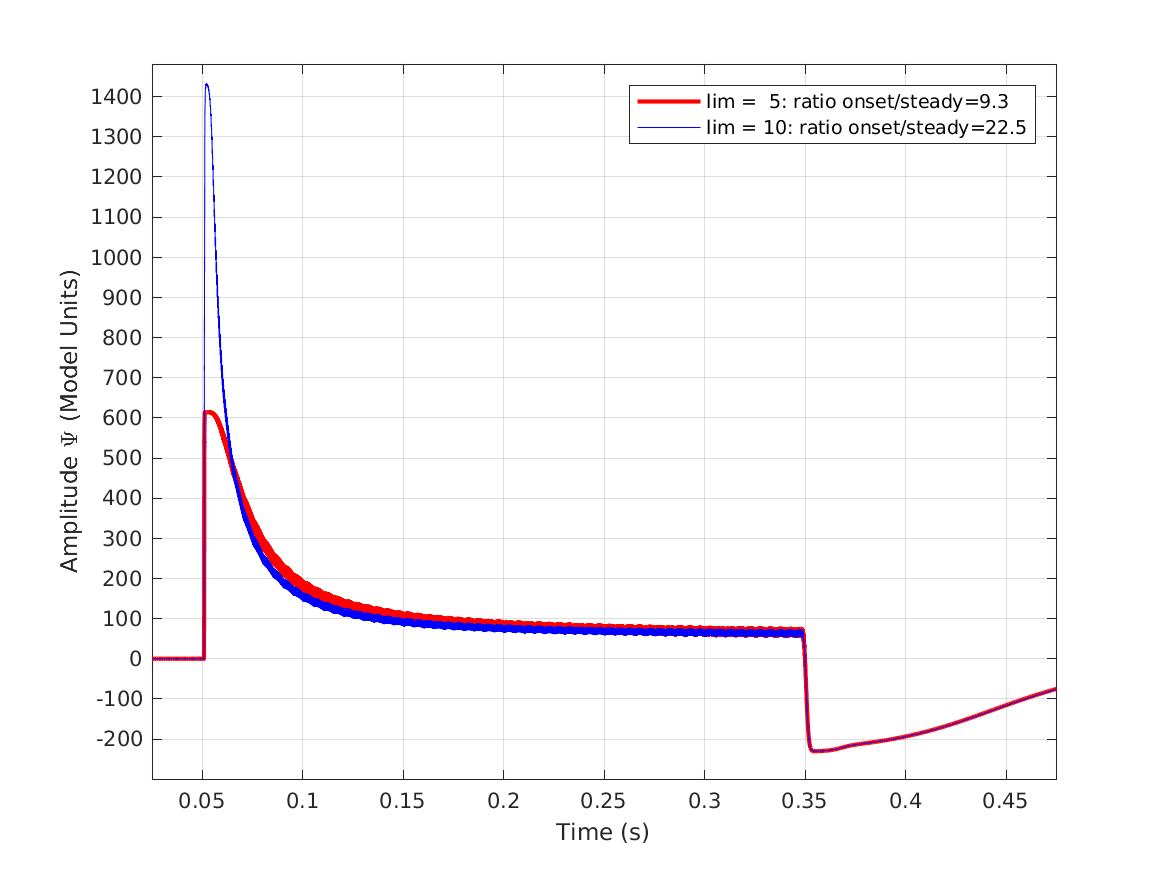
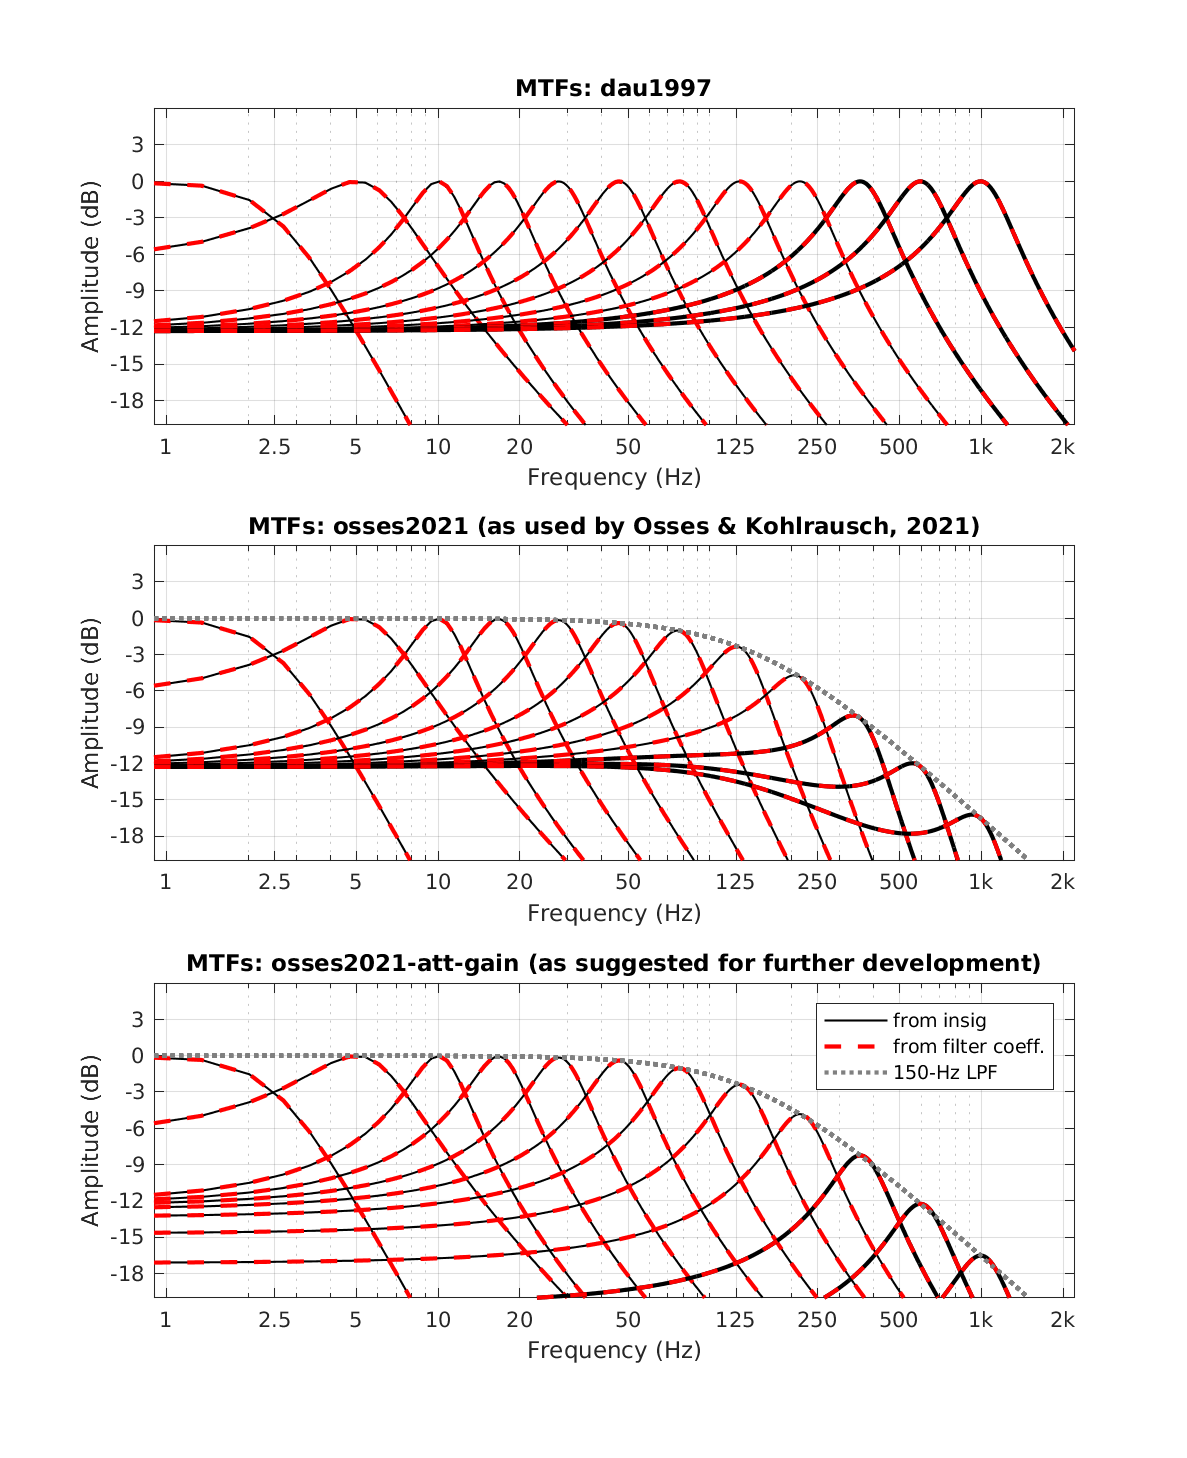
Fig. 14 - Modulation transfer functions for the 12 modulation filters in modfilterbank.m. This figure is obtained for a click of unit amplitude while all modules in osses2021 are by-passed except for the modulation filter bank. In the modulation filter bank, the phase insensitivity for filters with mfc>10 is disabled (see App. C of Osses and Kohlrausch, 2021) in a way that the outputs of the modulation filter are the complex valued filtered signals for each mfc. To display Fig. 14 of Osses and Kohlrausch (2021) use
out = exp_osses2021('fig14');


Build with Bootstrap