THE AUDITORY MODELING TOOLBOX
This documentation page applies to an outdated AMT version (1.1.0). Click here for the most recent page.
EXP_MCKENZIE2021 - experiments from McKenzie et al
Usage
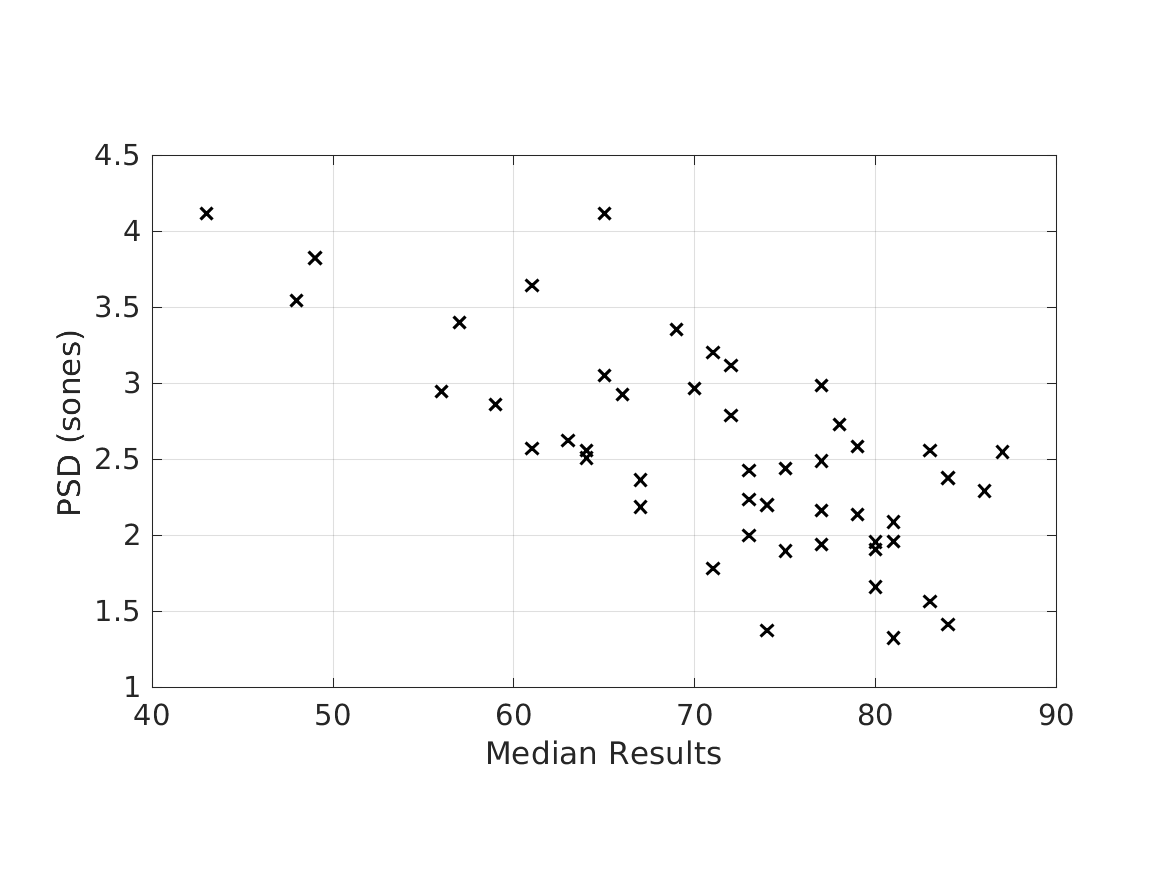
exp_mckenzie2021('fig10d'); % (to plot Figure 10 d).
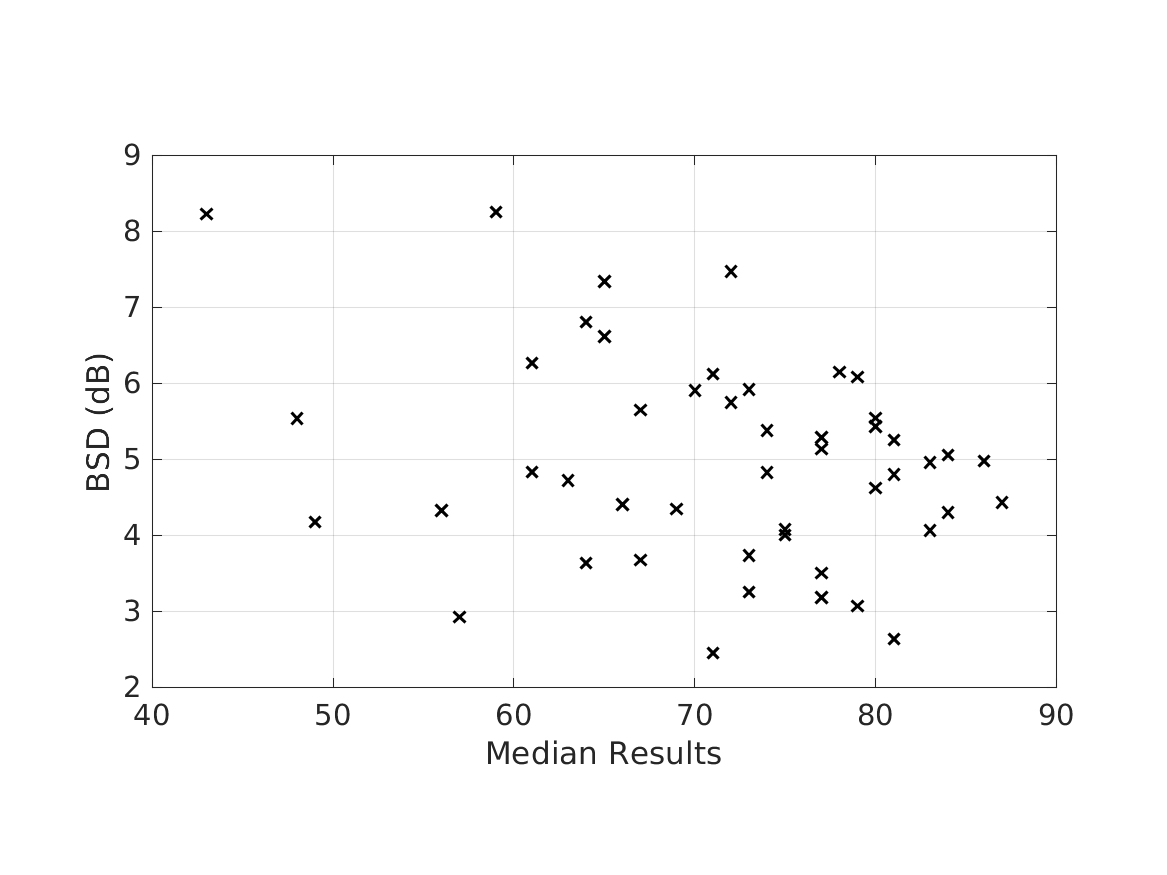
exp_mckenzie2021('fig10a'); % (to plot Figure 10 a).
Description
Reproduces the plots in the listening test section (Figure 10a-d) in the Acta Acustica paper: McKenzie, T., Armstrong, C., Ward, L., Murphy, D. T., & Kearney, G. (2021). A Perceptually Motivated Spectral Difference Model for Binaural Signals. Acta Acustica (in review).
Read in perceptual listening test results and compare correlation of median results to spectral difference values between the reference and test stimuli. The listening test results are from the following paper: McKenzie, T., Murphy, D. T., & Kearney, G. C. (2018). Diffuse-Field Equalisation of Binaural Ambisonic Rendering. Applied Sciences, 8(10). https://doi.org/10.3390/app8101956 The test compares binaural Ambisonic sounds with and without diffuse-field equalisation to HRTF convolution sounds.
PEAQ and CLL are commented out in this script so that it runs without any additional files necessary. To produce the respective data, download the PEAQ and CLL code: https://github.com/NikolajAndersson/PEAQ and www.acoustics.hut.fi/-301ville/software/auditorymodel/. The test sounds (ts.... etc) must be saved as wav files to work with the PEAQ model.
Examples:
To display Figure 10a use
exp_mckenzie2021('fig10a');
This code produces the following output:
BSD correlation=-0.28332, p=0.051013
To display Figure 10d use
exp_mckenzie2021('fig10d');
This code produces the following output:
PSD correlation=-0.70767, p=1.863e-08


Build with Bootstrap