THE AUDITORY MODELING TOOLBOX
This documentation page applies to an outdated AMT version (1.1.0). Click here for the most recent page.
Go to function
DATA_ELBERLING2010 - ABR wave V data as functon of level and sweeping rate
Usage
data = data_elberling2010(flag)
Output parameters
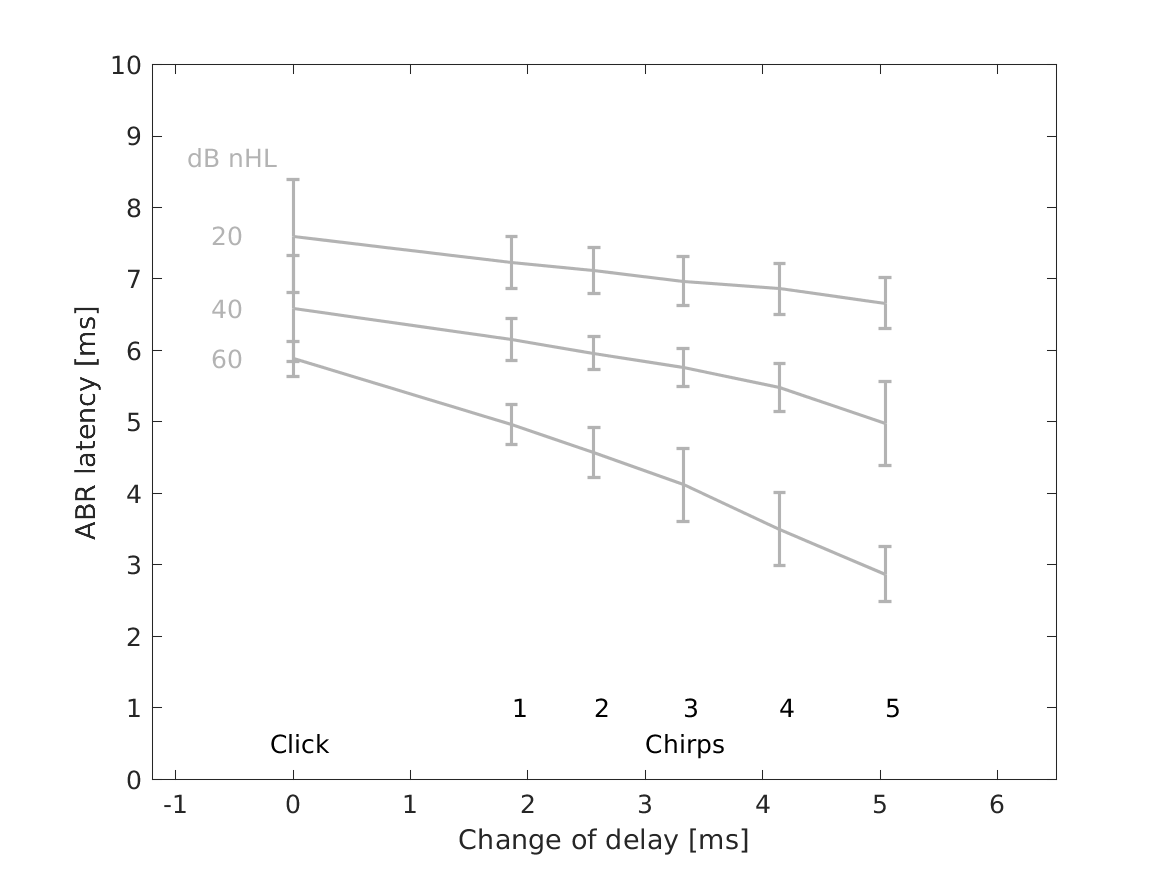
| delay | "x-axis" - sweeping rate delay between 710Hz and 5700Hz |
| data_mean | Mean of data |
| data_std | Standard deviation of data |
Description
data_elberling2010(flag) returns data points from the Elberling et al. (2010)
The flag may be one of:
| 'no_plot' | Don't plot, only return data. This is the default. |
| 'plot' | Plot the data. |
| 'fig4' | Data from Fig. 4, Amplitude of wave V. |
| 'fig5' | Data from Fig. 5, Latency of wave V |
| 'stim' | Return the stimulus and the sampling frequency. XXX Describe the data. XXX change 'stim' to figure no., if applicable. |
Examples:
Figure 4 can be displayed using:
data_elberling2010('fig4','plot');
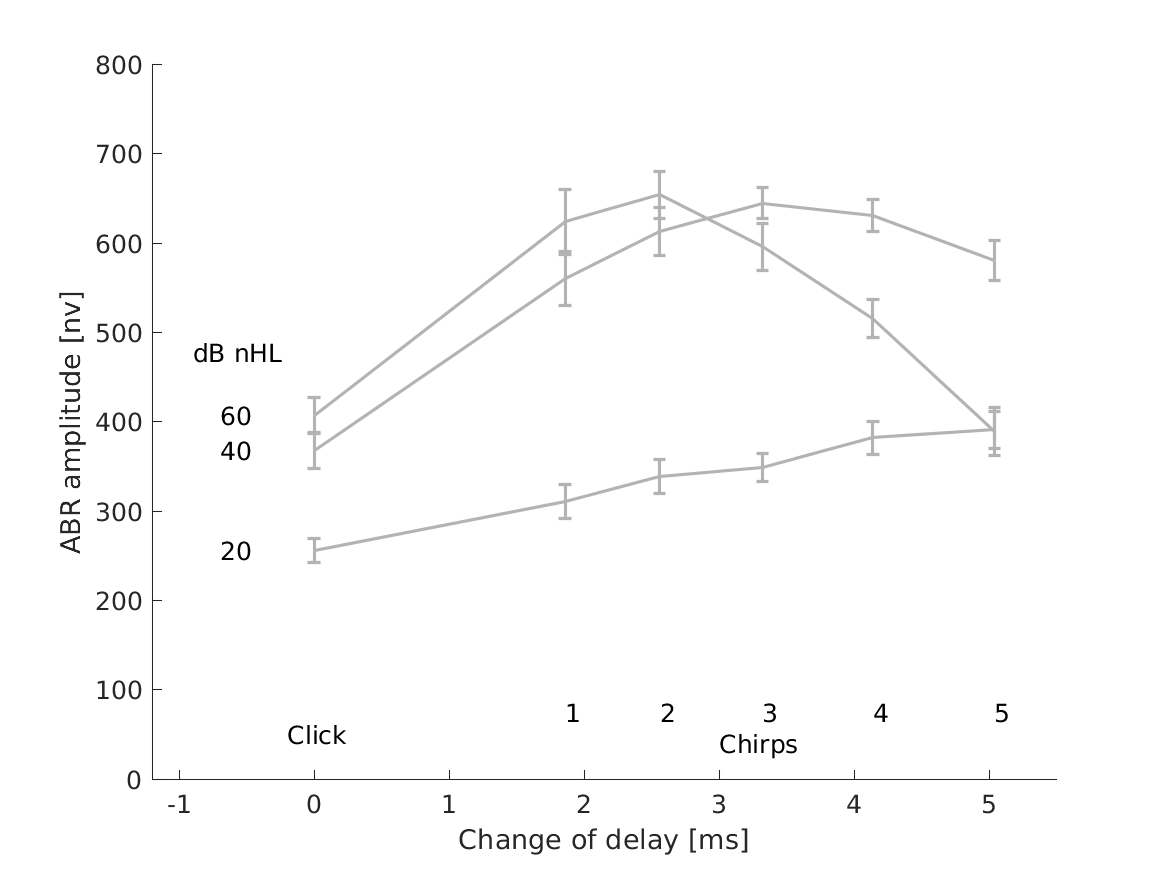
Figure 5 can be displayed using:
data_elberling2010('fig5','plot');
References:
C. Elberling, J. Calloe, and M. Don. Evaluating auditory brainstem responses to different chirp stimuli at three levels of stimulation. J. Acoust. Soc. Am., 128(1):215--223, 2010.


Build with Bootstrap